Project Overview
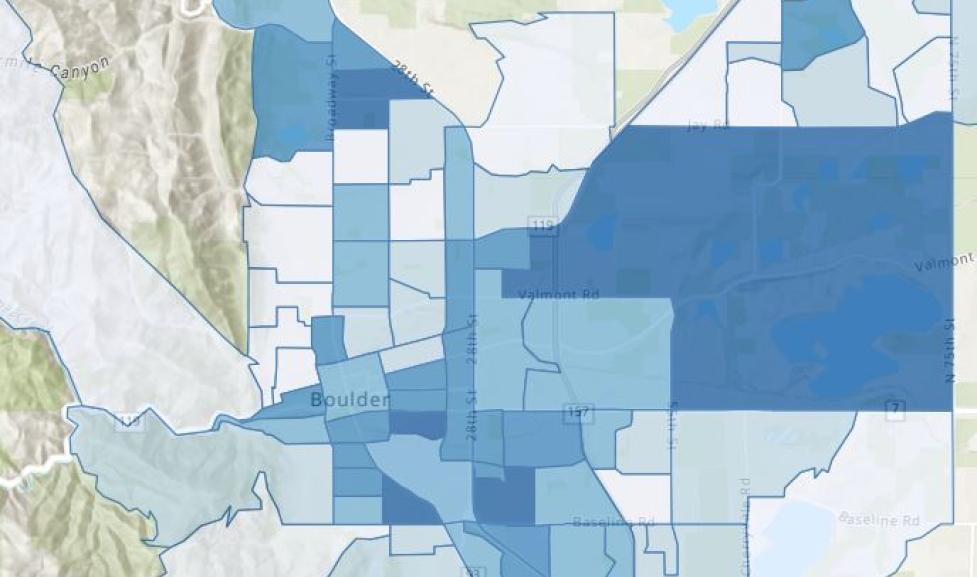
Racial Equity Index Map helps city staff assess equity from a geographic perspective.
The equity index map captures race, ethnicity and socioeconomic data in a geographic format. Areas with larger BIPOC populations and those with lower median income rank higher on the map.
City staff are already finding many applications for the Equity Index Map. Examples include the Transportation Master Plan and community engagement planning.
Background
The city adopted its first-ever Racial Equity Plan in 2021. The plan emphasizes the importance of collecting and analyzing meaningful data so that we can measure our progress. As a first step, the city has been working to develop sources of data. These data sources help the city bring an equity focus to all our decisions.
Map Methodology
The Equity Index Map considers four variables to rank Census block groups:
- Percentage of the block group population that are Black, Indigenous, and People of Color (BIPOC)
- Median income by block group
- Percentage of the block group population living below the poverty line
- Percentage of the block group population receiving financial aid through Housing and Human Services (HHS) aid programs
The map weighs percentage of black, indigenous, and people of color (BIPOC) population, median income, percentage living below the poverty line and percentage receiving financial assistance through the city’s Housing and Human Services aid programs to produce an equity score for each census block group. Census block groups with a higher score are a higher priority for programs and services under the city’s commitment to advancing racial equity.
